

How high the professionals are looking
Up to $7 150 per ounce — the potential 2026 high outlined by Julia Du, an ICBC Standard Bank analyst, in the LBMA survey. From $4 000, that represents almost 79% potential price growth.
Julia Du · ICBC Standard Bank
$7 150 is a potential annual high in an individual analyst’s forecast published by the LBMA. The other figures are bank price targets with different time horizons.
Central bank purchases, reserve diversification, high public debt and geopolitical uncertainty support interest in gold. UBS explicitly views a decline towards $4 000 as an opportunity to increase exposure.
A familiar price.
A new starting point.
In early October 2025, gold first broke above $3 900. In January 2026, the market reached a record of around $5 595. By late October, after a deep correction, the price was back near $3 900.
Politics is already adding momentum: on 4 November, Reuters reported that gold rose by about 3% as the dollar weakened following Democratic gains in the US midterm elections.
Market levels are rounded; these are individual price points, not monthly averages. October 2025 ↗ · October 2026 ↗ · 4 November ↗
How the gold strategy traded these moves
Residents of iPO COMMUNITY use the gold strategy to trade movements in gold. Since June 2025, we have publicly shared results through a challenge: #челлендж_показываем_счет ↗.
gold. Month by month
The strongest months in the published period
One trend — many trading opportunities
Gold does not need to multiply in price for an active strategy to deliver a strong result. Within a major move, the price rises, corrects and rises again. A series of trades makes it possible to trade individual sections of that journey.
$3 447,72 → $3 862,88
+12,0% gold price movement+88% gold strategy$3 862,88 → $4 381,49
+13,4% gold price movement+160% gold strategyPrice changes between the levels marked on the supplied chart, up to the peak of each move. The strategy’s result is for the corresponding month, before profit distribution. These are different measures.
The market and real trades
For those who want to look closer: how the result is generated
The October statement shows a series of trades taking profit at different levels. In the September statement, the closed trading result was $24 883,91; in October, it was $119 220,37. The accounts had deposits and withdrawals, so these amounts cannot be directly converted into a monthly percentage.
Sequential trades, position sizes and leverage explain the difference between the metal’s price growth and the strategy’s result. Volatility creates trading opportunities, but does not by itself ensure a profit.
Open the challenge and check the results ↗The compressed spring effect
A price following a deep correction combined with sustained long-term demand is drawing attention back to gold. For the gold strategy, a recovery with corrections and renewed impulses is particularly interesting: a single major move can offer many individual trading segments.
As soon as the pressure from high interest rates and a strong dollar eases a little, gold will have additional room to recover. The structural reasons for interest in the metal remain in place — which is why the current situation can be compared to a compressed spring.
The market seems to be waiting
for just a slight push.
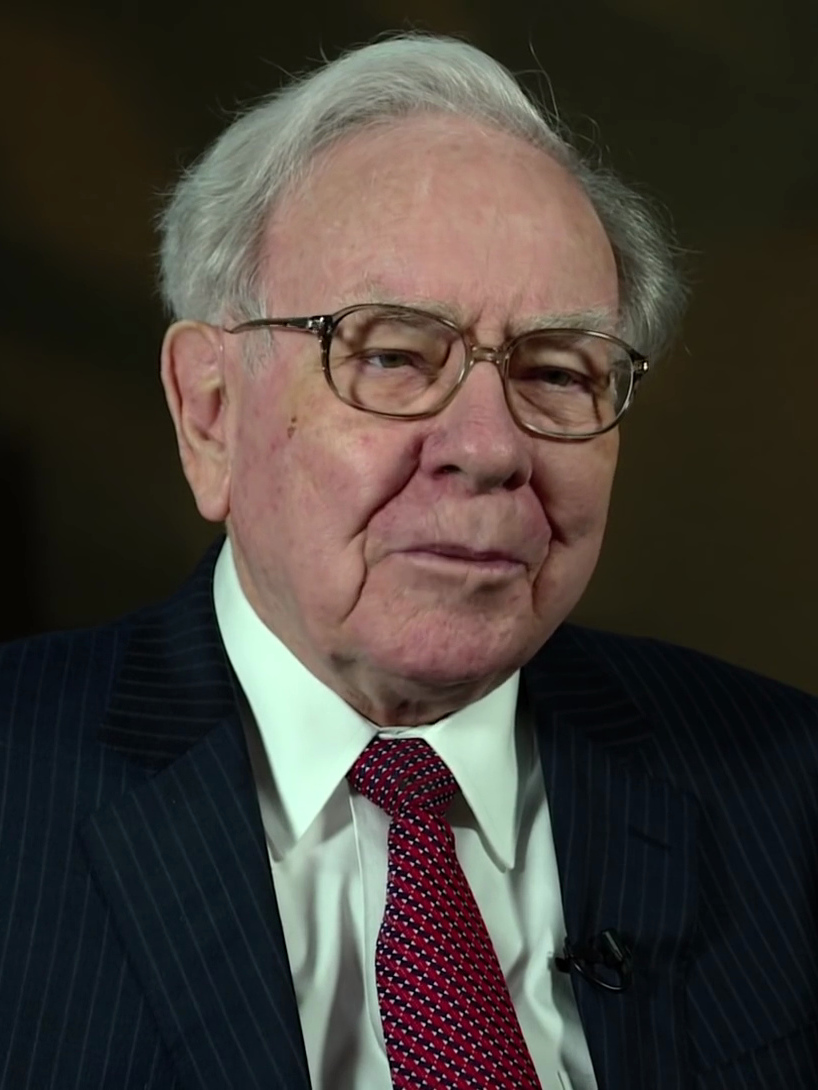
“When it’s raining gold, reach for a bucket, not a thimble.”
Prepare for the move — in advance
For those already using gold, the current situation is a reason to consider increasing the capital at work. For new participants, it is a chance to explore the strategy, check its history and decide on an appropriate level of participation.
Past performance does not guarantee future returns. But the market does not wait: while some watch, others prepare to act.
Gold’s next chapter still lies ahead.
Be ready to meet it.
Analytics Department iPO COMPANY4 November 2026 · iPO Journal
Sources and materials
Forecasts are available through the links in the bank cards. Strategy data: iPO public challenge, June 2025 — September 2026. Percentages are shown before profit distribution.
Gold photo: Scottsdale Mint / Unsplash. Buffett photo: USA International Trade Administration / Wikimedia Commons, public domain. Mentioning Buffett does not imply his involvement in the strategy.
Quote source: Warren Buffett’s letter to Berkshire Hathaway shareholders ↗.